 A pie chart is a circular statistical chart that is used to represent percentages.
It illustrates the numerical proportion of constituents and are used in business, media, sales, marketing and other industries.
A bar graph, on the other hand, can be used to represent fixed quantities with tall rectangular bars in proportion to the number, while a line graph is useful for showing the evolution of a data over time.
In this list we see 8 free sites to create pie, bar and line charts quickly and easily, with tools to collect input data also from CSV or Excel files, e create immediate charts to share or save as images.
Each site allows you to customize the appearance of the charts choosing if make them 2D or 3D, add labels to show data values and in some cases even with the ability to make the graphs interactive and make direct changes.
1) Meta-Chart.com is a free web charting application that allows you to create professional-grade pie, line, bar, histogram, and many other types, in 2D and 3D, in four simple steps. In the first you choose the type of chart, for example pie, in the second the color scheme for the chart, if you want a 2D pie chart or a 3D pie chart and enter the data.
You can write the data from here or even import it from a CSV file. After entering the data, you can add labels to the pie charts in the third step.
Once you have completed all the steps, you can try out various themes and select which labels to display. Eventually you can download the graphic as a PNG, JPEG, SVG or PDF file.
2) ChartGo.com is a site that also allows you to insert data from an Excel sheet and customize the chart in every aspect. By pressing the Start button, the construction of the graph is started by selecting the type (pie, bar, line, etc.), the dimensions, the labels, the colors, the graphics and the data to be represented. Everything is done on one page, quickly and directly. Once you have specified all the style and personalization settings, you can import data from an Excel file.
3) OnlineChartTool.com is a free website to create various types of charts: bar chart, line chart, area chart, pie chart, bubble chart, meter chart and others. The process of creating a pie chart is super easy, just use the options provided in the wizard, choose the color, type, appearance, etc. and then enter the data or import a CSV file. You can then add labels and select the font and color to see the words. After previewing the chart, you can save it as a PNG, JPG, SVG, PDF and CSV image.
4) RapidTables.com offers various online tools to quickly create tables, graphs and diagrams of all kinds, with options for entering title, data and values. For the pie chart choose Pie chart maker, for the line graph Line graph maker, and for the bar graph, Bar graph maker. Once the graph is done, it can be quickly changed in values or saved as a PNG, JPG, SVG, PDF and CSV file.
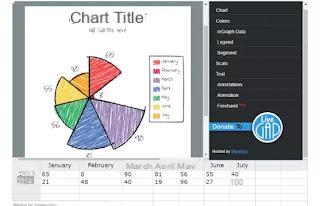
5) LiveGAP.com is a free online diagram generator to create elegant graphs with the possibility of choosing different styles, even very original ones. You can customize the pie chart by selecting colors and adding data, resizing parts and adding animations. LiveGap is perhaps the best at creating bar charts, with 15 predefined templates that you can customize.
6) Canva Charts offers another great way to create stunning bar, line or pie charts for free. To create a bar chart, you just need to open the Canva editor, go to the "Elements" tab on the left and select the chart option. You can then choose the one you like best and customize it. Canva only creates basic charts with simple datasets.
7) Chart Blocks is a free and professional website for creating graphics, which requires you to register for an account. The wizard will ask you to insert the datasets also by importing them from a CSV file, choose the type of chart, for example pie or bar, create data series by changing the X / Y columns.When everything is ready, go ahead and choose any of the predefined templates. You can also share the final graphic, save it online or download it as a PDF, PNG, JPG, etc. The free version of ChartBlocks allows you to create and maintain up to 50 charts.
8) ThreeGraphs is a simple site with which to quickly create 3D pie, bar or area charts.
9) Flourish Studio, finally, the best creator of dynamic graphics that can be found, with the possibility of updating them automatically by filling in data on an Excel sheet and creating them automatically. Flourish is a professional platform that can be used for free as long as the graphics created are public.